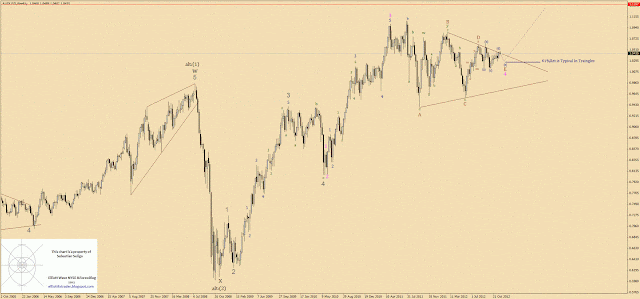
On Weekly chart I present Bullish option for more upside progression in this pair as wave (e) might be finished after ABC Irregular Flat Correction.
The sdame count is one of Daily Chart for Bulls and Bears. Please Bear in mind I still have a daily chart with Bullish opition in it.
On H4 chart we are missing one more wave to the upside (purple count) after this rather deelp pullback in wave 4. This bullish option for a niw high is still in play because wave 4 did not overlapse wave 1 yet. Nevertheless, lack of impulsive progression to the upside will sooner then later void the count. If it is so, then selling into 61%FiboRet would be possible as we can assume that wave (d) has topped @ 1.0490 in three ABC waves where wave C is in three waves as well (or my count is wrong).
In anticipation of wave (e) to bottom at typical for a triangle 61%Ret we can set buy limit orders into orange rectangle area of 1.0286 - 1.0280 with a tight stop. This set-up provides the gratest R/R ratio.
Take care,
Seb
Source | Elliott Wave NYSE And Forex Blog | http://elliottfxtrader.blogspot.com/2012/12/audusd-h4daily-update-tpi.html


No comments:
Post a Comment